


Detainable deficiencies have increased by 41%
In 2025, AMSA inspected 2,481 domestic commercial vessels (DCVs) and issued 8,380 deficiencies. Seemingly, that’s good news for the industry as the average vessel picked up 3.38 deficiencies per inspection, down from 3.69 the year before, an 8.4% improvement.
Yet, the number of deficiencies serious enough for AMSA to stop a vessel operating rose from 140 to 198, a 41.4% increase in a single year. Detentions climbed from 76 to 101, and the share of inspections ending in a vessel being stopped went from 3.34% to 4.07%.
AMSA is inspecting fewer, riskier vessels, and when they find something they’re more likely to stop them from operating.
Why AMSA is inspecting riskier vessels
AMSA refined its DCV targeting model in 2025. Rather than inspecting vessels because they were due, inspectors were directed toward vessels the model flagged as higher risk. These inspections were based on compliance history, vessel age, construction, operation and certification status.
If your vessel has a clean record, you may see AMSA less often than you used to. If it doesn’t, you will see them more and the inspection will go deeper.
What does this mean for me?
What matters more now is not the number of deficiencies, but rather which deficiency is likely to trigger a prohibition, direction or detention notice and stop you carrying passengers, catch or cargo.
This post sets out what those deficiencies were in 2025, which vessel classes carried them, and what you can check before an inspector steps onboard next.
AMSA’s findings in 2025
In 2025, compliance findings across domestic commercial vessels had improved.
| Inspections | 2024 | 2025 | % change |
|---|---|---|---|
| Vessels inspected | 2,275 | 2,481 | +9.1% |
| Deficiencies issued | 8,397 | 8,380 | -0.2% |
| Deficiencies per inspection | 3.69 | 3.38 | -8.4% |
| Detainable deficiencies | 140 | 198 | +41.4% |
| Vessels stopped from operating | 76 | 101 | +32.9% |
| Share of inspections ending in a stop | +3.34% | +4.07% | +0.73% |
| Vessel class | Inspections | % share |
|---|---|---|
| Class 2 - Non-passenger | 1,076 | 43.4% |
| Class 3 - Fishing | 663 | 26.7% |
| Class 1 - Passenger | 427 | 17.2% |
| Class 4 - Hire and drive | 258 | 10.4% |
| Other | 57 | 2.3% |
Queensland (920) and New South Wales (668) accounted for nearly two-thirds of all DCV inspections. Western Australia followed at 383, then Victoria (144), Tasmania (139), South Australia (131) and the Northern Territory (65). Of note, South Australia went from 27 inspections to 131, a near five-fold increase.
If you operate in a region that saw little AMSA presence in the past, that may no longer hold true.
AMSA watched 122 crews perform under instruction
Roughly one in twenty (122 of the 2,481) inspections included operational monitoring. In which not only did the inspector review the paperwork, but they also asked the crew to perform an emergency drill or operational procedure.
Before you continue, try answering these questions in relation to your operation.
- At your last inspection, how many deficiencies did you receive? Above or below 3? Note that the average was 3.38 in 2025.
- Were any of them classed as high-risk: a prohibition, direction or detention notice?
- If an inspector asked your crew to run a drill tomorrow, unannounced, how would it go?
The three major deficiencies
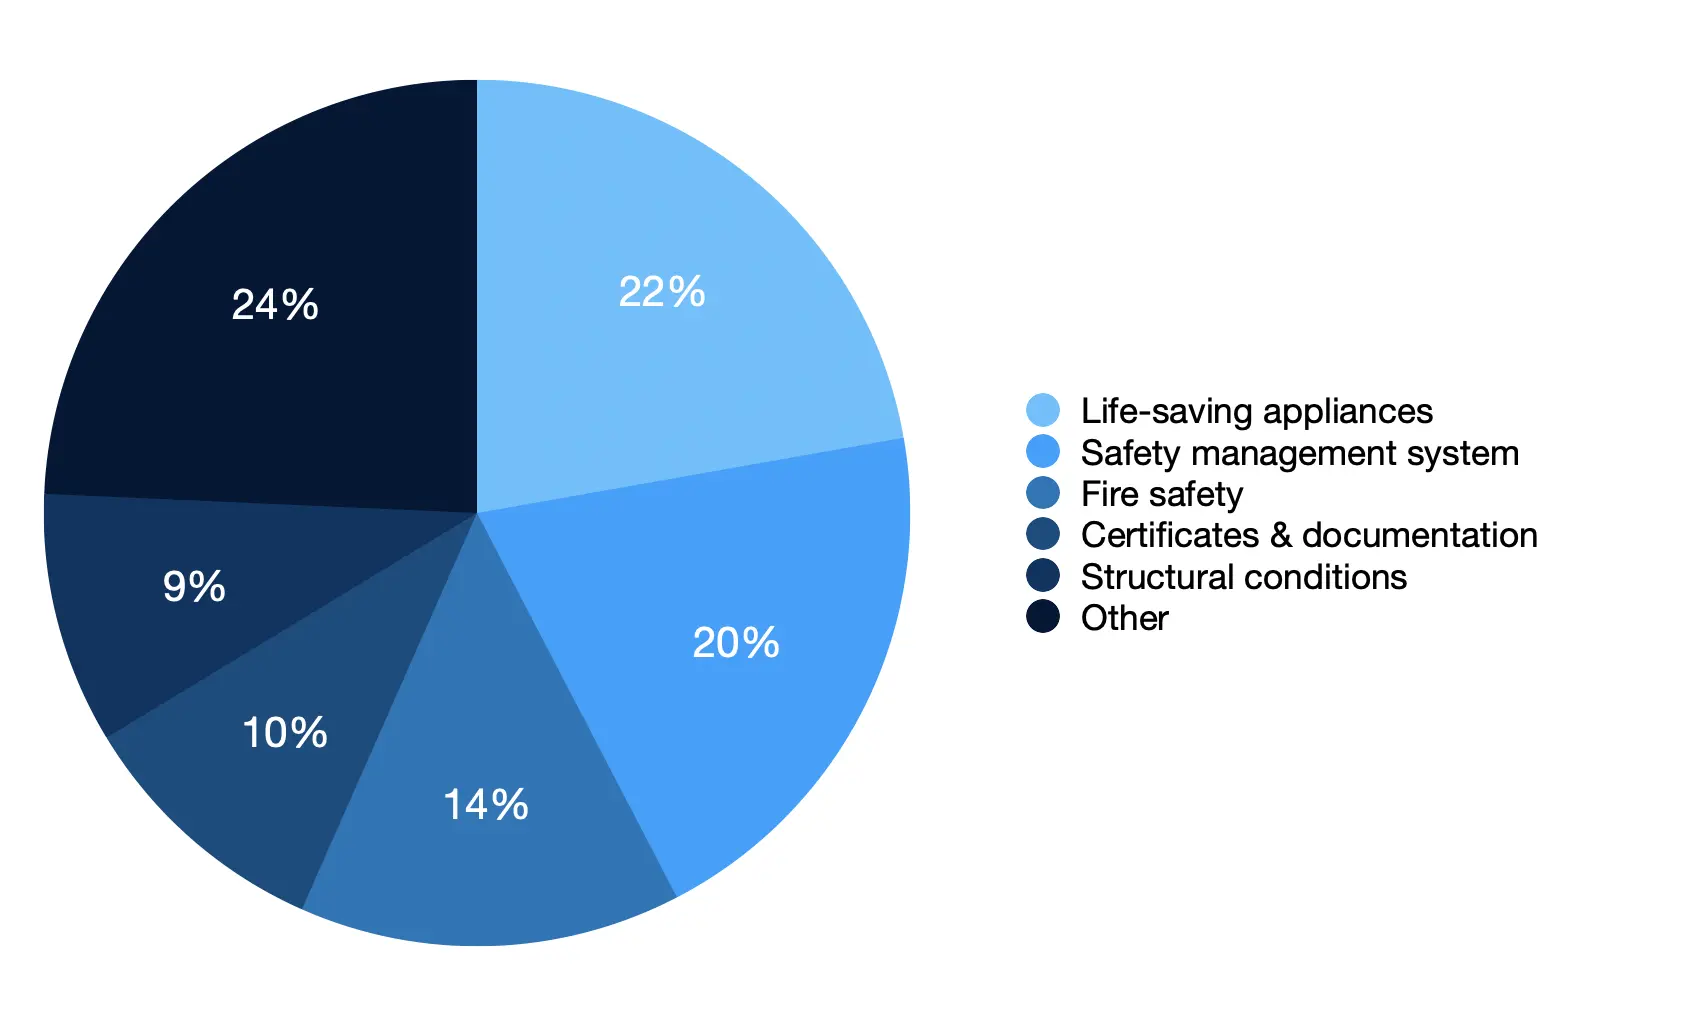
Life-saving appliances, safety management system (SMS), and fire safety account for 4,745 findings. Roughly 57% of all domestic commercial vessel deficiencies.
| Category | Deficiencies | % share of all findings |
|---|---|---|
| Life-saving appliances | 1,862 | 22.2% |
| Safety management system | 1,688 | 20.1% |
| Fire safety | 1,195 | 14.3% |
| Combined | 4,745 | 56.6% |
Life-saving appliances
This is the category most exposed to time rather than effort. Servicing dates lapse. EPIRBs expire. Flares date out. Lifejackets degrade.
1,862 findings, up from 1,826 in 2024. The only one of the big three to increase year over year.
Importantly, under the Marine Order 504 changes since 1 June 2025, lifejacket wear must be addressed in your risk assessment and in SMS procedures. Carrying the right lifejackets is no longer sufficient on its own.
Safety management system
AMSA’s own conclusion is blunt: the problem is not whether an SMS exists, it’s whether it’s correctly implemented.
Fire safety
Total findings fell slightly since 2024. But fire safety deficiencies serious enough to stop a vessel rose from 8 to 29. It is the largest proportional jump anywhere in the 2025 dataset. Fire safety was the third most common reason a domestic vessel was stopped from operating.
Note
These three categories are where others were most likely to be found deficient. They are not ones which most often resulted in stoppages.
Vessel deficiencies per class
The fleet average of 3.38 deficiencies per inspection is skewed.
| Class | Inspections | Deficiencies | Per inspection |
|---|---|---|---|
| Class 3 - Fishing | 663 | 2,828 | 4.27 |
| Class 1 - Passenger | 427 | 1,613 | 3.78 |
| Class 2 - Non-passenger | 1,076 | 3,177 | 2.95 |
| Class 4 - Hire and drive | 258 | 647 | 2.51 |
| Total | 2,481 | 8,380 | 3.38 |
Fishing vessels carry the highest deficiency rate, 70% higher than hire and drive, and above the total average by nearly a whole deficiency per inspection.
Vessels found with the most severe deficiencies
The vessel classes found to have the most deficiencies were not, in fact, the same ones that resulted in the most stoppages.
| Class | Share of inspections | Share of stoppages | Inspections ending in a stop |
|---|---|---|---|
| Class 1 - Passenger | 17.2% | 29.3% | 13.6% |
| Class 3 - Fishing | 26.7% | 32.3% | 9.7% |
| Class 4 - Hire and drive | 10.4% | 7.6% | 5.8% |
| Class 2 - Non-passenger | 43.4% | 29.8% | 5.5% |
Passenger vessels were inspected less often than fishing vessels and picked up fewer deficiencies per inspection but were the most likely of any class to be stopped. Roughly one in seven passenger vessel inspections ended with the vessels unable to operate.
Fishing vessels generate the most findings while passenger vessels generate the most serious ones.
Passenger vessels are the largest share of inspections by a wide margin, but one of the lowest stoppage rates of any class. This was likely caused by the sheer volume of inspections, and not a concentration of risk.
Non-passenger operators are the most-inspected class and the least likely to be stopped. And lastly, hire and drive operators have the lowest deficiency rate in the fleet.
What AMSA may look out for next
AMSA publishes its priorities a year ahead. The National Compliance Plan 2026-27 took effect on 1 July 2026 and names four focus areas for domestic vessels:
- Electrical safety
- Watchkeeping and lookout practices
- Fatigue management
- Safety management system implementation
AMSA has committed to 2,300 DCV inspections in 2026-27. Although slightly fewer than the 2,481 conducted in 2025, it is consistent with the continued narrowing of their targeting model.
These priorities are not a guarantee of enforcement, and AMSA’s stated approach is usually education first, then focused inspections.
What appears in a compliance plan tends to appear in the deficiency data months later, and so, the priorities listed above are what we believe are worth getting on top of.
Deficiencies found in 2025
| Category | 2025 count | 2025 % share | 2024 count | YoY change | |
|---|---|---|---|---|---|
| 1 | Life-saving appliances | 1,862 | 22.22% | 1,826 | +36 |
| 2 | Safety management system | 1,688 | 20.14% | 1,797 | -109 |
| 3 | Fire safety | 1,195 | 14.26% | 1,235 | -40 |
| 4 | Certificates & documentation | 813 | 9.7% | 687 | +126 |
| 5 | Structural conditions | 786 | 9.38% | 860 | -74 |
| 6 | Labour conditions | 613 | 7.32% | 520 | +93 |
| 7 | Safety of navigation | 442 | 5.27% | 452 | -10 |
| 8 | Radio communications | 343 | 4.09% | 414 | -71 |
| 9 | Propulsion & auxiliary machinery | 257 | 3.07% | 269 | -12 |
| 10 | Water / weather-tight integrity | 240 | 2.86% | 209 | +31 |
| 11 | Alarms | 75 | 0.89% | 63 | +12 |
| 12 | Emergency systems | 33 | 0.39% | 38 | -5 |
| 13 | Pollution prevention | 25 | 0.3% | 22 | +3 |
| 14 | Dangerous goods | 6 | 0.07% | 5 | +1 |
| 15 | Other | 2 | 0.02% | 0 | +2 |
| Total | 8,380 | 100% | 8,397 | -17 |
Sources and method
Every statistic in this post is drawn from published Australian Maritime Safety Authority material. The primary source is AMSA’s 2025 Annual Inspections Report, released in March 2026, as well as the following:
- AMSA, 2025 Annual Inspections Report
- AMSA, Inspections report 2025
- AMSA, National Compliance Plan 2026-27 and National Compliance Plan 2025-26
- AMSA, Marine Order 504, and AMSA’s guidance on the SMS changes effective 1 June 2025
- AMSA, Domestic commercial vessel inspections
This post is based on data from 2025. AMSA publishes inspection data annually. At the time of writing there is no aggregated 2026 dataset.
Only domestic vessels were considered. Foreign-flagged ships and regulated Australian vessels are inspected under separate legislation and have been excluded throughout. Figures quoted elsewhere in the industry sometimes combine all three.
Some figures are calculated. Where we’ve compared categories or classes (severity rates, stoppage rates by class) those are our calculations from AMSA’s published counts, not figures AMSA publishes directly.
A “detainable deficiency” is an individual finding (a stopped vessel may carry several). In 2025, 198 detainable deficiencies resulted in 101 stopped vessels.
We prepared this post in August 2026, using AMSA data current to that date. Regulatory requirements change. Always verify current obligations at amsa.gov.au before acting on anything here.
Need more help?
In this post we covered what AMSA found in 2025. We have not covered your own vessel(s).
At Fathom Fleet we offer dedicated support and guidance so that you stay compliant. See how we can help with your Safety Management System and compliance obligations.